Over the past 20 years there have been many changes impacting the output of our nation's timberland but none have impacted it as much as the management of our National Forests. First, let’s talk big numbers and try to put the whole thing into perspective. There are about 750 million acres of forestland in the United States. About two-thirds of that is classified as “timberland” which is defined as “Forest land that is producing or capable of producing crops of industrial wood and not withdrawn from timber use by statute or administrative regulation”. That definition cuts the area in timberland from 750 million acres to about 500 million acres. Much of the reduction results from set asides such as the National Parks and the designated Wilderness Areas on National Forests.
So now we have 2/3 of our forests left to produce wood products.
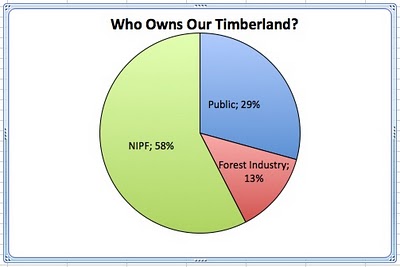
Second, let’s look at that two-thirds or 500 million acres of timberland. Who owns it?
Even after setting aside our forested parks, Wilderness Areas and forest preserves, public ownership still accounts for almost 30% of our timberland. Public ownership is more than twice that of Forest Industry and about one-half of that owned by Non-Industrial Private Owners. Due to the historical method of “keeping score”, TIMO and REIT ownership is somewhat befuddled and some shows up in the NIPF category and some shows up in Forest Industry. The point I want to make here is that any shift in the way that the 150 million acres of Public timberland is managed has far reaching implications for output of building materials, pulp and paper and biomass utilized for renewable energy. The vast majority of the Public timberland falls under the management of the National Forest System (NFS) so that is where we need to look for change. I have watched these changes occur over time but it wasn’t until I came across the following graph that the total impact was driven home to me.
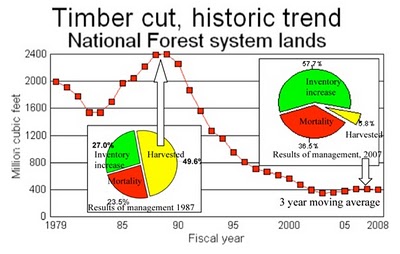
There are two points on the graph, both designated with arrows, which will be discussed. The first arrow highlights the peak of NFS harvest as well as the beginning of the impact of the Spotted Owl controversy. The corresponding pie graph sets an interesting baseline. Even though the timber harvest has peaked, only one half of the growth was being harvested and one-quarter of the growth was actually being added to the timber inventory! The second pie graph shows the impact of a forest policy that reduced the harvest to 1/6th of what it had been. The result is that less than 6% of growth is being harvested, 58% is being added to inventory and a staggering 36.5% of growth is dying! We are growing trees for bugs and fire. So who is to blame? Public forests are managed by public policy.
To my mind, this is a terrible trend but it is good for owners of timberland
